Indoor Mushroom Grower Scenario Research
In 2020, we collaborated with Fungi Ally on a grant with funding from NE-SARE and engaged potential growers in a number of educational efforts. Growers that were ready to jump into a commercial enterprise applied for consulting support and assistance in exchange for collecting and sharing data on their production figures, sales, and labor and material costs. These are new operations that are starting up production in their first or second year.
We are grateful for the fourteen growers who initially signed up and the five farms who were able to produce data sets we could analyze. Of course, 2020 was a challenging year given the COVID-19 pandemic, so some reasons growers may not have been able to complete a data set included being too busy, deciding to stop or delay production, or some other range of life circumstances that arose.
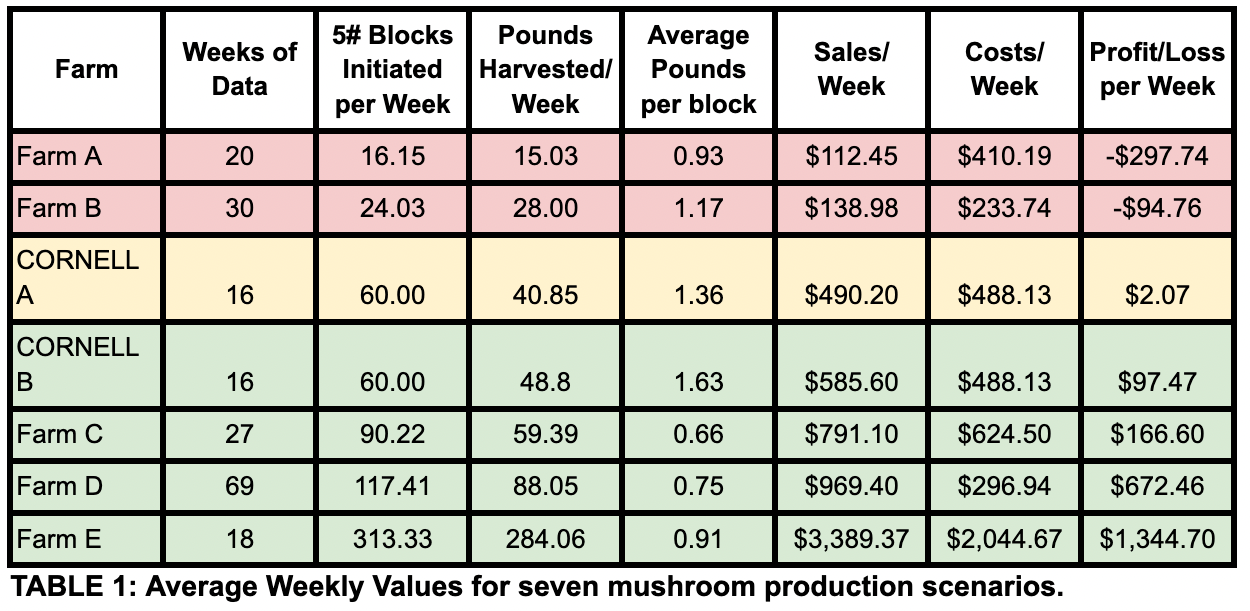
Table 1 below summarizes the datasets we received from five farms as well as the Cornell block studies also conducted in 2020, which to some degree can be thought of as a “control” as a comparison to the more dynamic nature of actual on-farm production.
Of these seven examples, three sites purchased in blocks and three sites made their own blocks on the farm. Some farms utilized 10 pound blocks and others 5 pound blocks, so for the purposes of comparison, we converted all the farms to utilize 5 pound block equivalents in our calculations.
The unique circumstances of each farm mean that there is a wide range in some of the elements that limit the value of comparison. We have a large range among farms as to the timeframe data was collected, from 16 to 69 weeks. There are also several variables and inevitably imperfect data for each farm. Thus, we ended up eliminating infrastructure costs (capital and fixed costs) in the analysis below, because the range here was too variable to compare farms. Instead, we focused on the operational costs (labor + materials) to give a snapshot of how average weekly production looked as a useful measure to assess the realities in production systems.
The table below is ranked by the number of blocks initiated per week. Interestingly, the Cornell trials fell to the middle of the group, and appears to be an indicator of a potential “break even” point, suggesting that farms doing 60 blocks a week should be able to realize profit. However, this does not mean that a smaller operation couldn’t find profitability, or that 60 blocks a week is sufficient. One factor in this is the residency of blocks in a grow room; for the Cornell research, blocks were left in the fruiting space for 8 full weeks, to capture the entire potential yield, reflected in the higher average pounds per block value.
Yet, most farms cycle blocks faster, often removing them after the first major harvest to make room for more new blocks. Given all the variability and difference between these seven examples, it's important not to directly compare one farm to another or make any conclusions about the right scale of enterprise. The farmers who participated all indicated that the data they collected was not perfect, but the best they could achieve amidst being busy focused on production.
The next section below uses a strategy of averaging values per block in order to create some reasonable projections for others to use. Perhaps the most important takeaway from the Table 1 summary is the wide variability of operations and their potential to be efficient in labor and material costs, production, and ultimately profit or loss.
One might be tempted to infer that based on dividing sales by pounds you could determine the price received per pound. We specifically did not include a $/lb figure because that can be misleading. Several of these farms have value-added products, spawn kits, supplies, workshops, other sales etc as part of the total. It was too hard to break all that out accurately, so note that sales in the overall enterprises is not just a direct result of pounds of mushrooms.
Individual Farm Summaries
Farm A is producing in West Virginia and initiated an average of 16 blocks per week, produced on site. This yielded an average of 15.03 pounds of mushrooms and generated $112.45 in income each week. Labor costs represented 80% of overall costs and were notably higher than the other operations, with 34% of time spent harvesting, 22% inoculating, 28% in delivery and sales, and 14% in packing and processing. At this pace and scale, the farm is operating at a loss. Increasing the number of blocks produced weekly and reducing labor costs would most improve profit and loss.
Farm B is producing in Massachusetts using ready to fruit blocks. Notable is that blocks were not added weekly but one or two times per month, which resulted in weeks of no labor/yield and then weeks where there was much higher activity, with some weeks with 50 - 90 pounds produced. An average of 24 blocks initiated each week produced 28 pounds which generated $138.98 in sales. Labor costs were 52% of overall costs, with 82% of the material cost being purchasing the ready-to-fruit blocks. Labor was 60% in harvesting, 0% inoculation, 21% sales, 17% packing and processing, and 2% other. At this pace the farm is operating at a loss. Increasing the scale of production would most improve profit and loss.
Farm C is producing an average of 90 blocks per week, made on site in Vermont. This yielded 59.39 pounds per week generating $791.10 in sales. Labor represented 67% of the operating costs and was spent 12% harvesting, 29% inoculation, 30% delivery and sales, 14% packing and processing, 6% cleaning, and 7% other. At this scale the farm is operating at a profit of $166.60 per week. Improvements in inoculation and delivery/sales efficiency would likely most improve the profit and loss for this enterprise.
Farm D is producing on blocks the farm made on site, in Eastern New York. The average blocks initiated per week was 117.4 and this yielded 88.5 pounds and generated $969.40 revenue per week. Labor represented 68% of the operating costs and was spent 9.9% harvesting, 34% inoculation, 46% delivery and sales, and 9.8% packing and processing. Notable about this operation are the wide range of value added products that enhanced weekly sales including mushroom kits, tinctures, workshops, and spawn for purchase. At this scale the farm was generating a profit of $517.89 per week. Improvements to this enterprise would most effectively focus on increasing the pounds yielded per block, which was the lowest of all the farms.
Farm E is initiating an average of 313 ready-to-fruit blocks a week in New York. This yielded 284 pounds for $3389.37 sales per week. The material costs represent 67% of the overall costs and are almost entirely ready-to-fruit block purchases which cost $1,402.50 per week. Labor breakdown is 20% on harvesting, 0% inoculating, 33% delivery and sales, 22% packing processing, 6% cleaning, 17% other. At this pace and scale, the enterprise is making a profit.
Average Numbers Per Block
Given all the variables of production on various farms, the best measure to compare these production systems more accurately is on a per five pound block basis. Table 2 summarizes the per block values for each farm.

Important values to consider include the average pounds harvested per block, which averaged across all the 5 participating farms was .88 lbs. (We left out Cornell blocks because of the excessive residency noted above). The costs per block value is also important, which accounts for both the material and labor inputs combined. The labor per block values give you a sense of how much labor factors into the overall cost.
One goal in facilitating and sharing this data is to provide some metrics for others to use in their planning to consider what production could look like. In order to do this, we first looked at the average of all five farms (two which showed a loss, three that showed profit), which when averaged generated a loss and a very exceptional value for the labor per block.
Averaging of the top four producing farms (one with a loss, three profitable) yielded a good set of values to consider as a “low” end of a continuum and then averaging just the three profitable ventures offered a good set of “high” values for scenario models. Averaging farms across a spectrum of profit/loss does dilute some of the details, but provides a more realistic picture for growers as they begin production. Table 3 shows the averaged values for these various groupings.

Averaging the above of course offers both good and bad outcomes. The average helps us compensate for variability, such as the high labor costs with some operations vs others, but it also hides the reality that each of these operations works very differently. The average values therefore offer a starting point for some projections but keep in mind that any enterprise should use values as a projection but also keep their own records to compare results over time.
Note that this summary accounts for only the “operating costs” which include the materials and labor to produce blocks and/or mushrooms. Absent are the wide range of capital, equipment, infrastructure, and other fixed costs like rent or utilities. There was simply too much variability in these from the sample farms, with an average total of $4,751.12 with highest $10,665.00 and lowest $694.85. In exit interviews, the growers observed that these values were not as accurately reported as compared to operating costs.
There is not a lot of value in averaging or integrating these in our overall averaging as the needs of these costs vary so widely. For instance, some enterprises may have started with a building or equipment on hand while others did not. Some reported rent and utilities and others did not. Thus anyone using the above values in projections should keep in mind this data summary covers only the base operating costs and should factor other indirect costs into their overall budgets.
Projecting the Potential
Based on these values in Table 3, we can project the potential values for operating a mushroom operation on a wide range of scales, expressed in blocks that are in the fruiting stage added to a grow room each week. Farms tend to produce seasonally or year round, so one could consider multiplying these by the number of weeks they might consider growing to consider what a whole operation could yield.
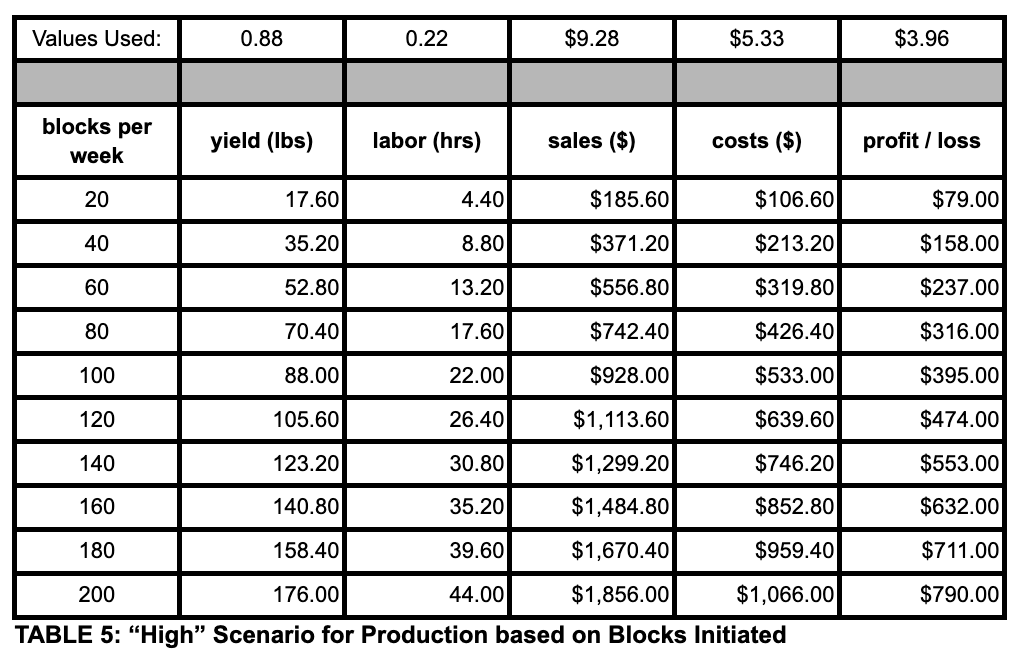
For these scenarios, we kept the yield per block at the global average across all the farms (.88), and note that the values for labor, sales, and costs on a per block basis only vary to a small degree, yet results in values that almost double profitability. Table 4 shows the “low” production scenario and Table 5 shows the “high” production scenario, with modest changes in sales and costs reflecting a substantial increase in profitability.


Keep in mind these projections are based on the original averages, so there is no accounting for the potential efficiencies of various scales. But, we can see that at around 60 blocks a week the enterprise becomes a full time job for one person, while generating a surplus profit of $82.66 to cover other indirect and investment costs. A 200 block per week operation might demand three full time people but generate a profit of $275.53 a week.
We are thankful for the participating farms and their data, which we can use to help others plan for successful enterprises via our online Indoor Crop Decision Tool. The initial data in this tool was an estimated projection from conversations with growers, but this grower data along with results from Cornell trials will be integrated into this tool in the Winter of 2022 and we expect to offer a second release using this data in Spring 2022. This will offer users a more realistic tool for projections in the future.
Lessons Learned
1) Ready to Fruit and BOS (Blocks on site) can both be profitable, or not.
Based on the data, there was not a clear “winner” in terms of overall profitability when thinking about the two approaches (more on this below) . Not surprisingly, what does seem clear is that within operating costs, labor is much more substantial when blocks are made on site, while materials costs are higher for those operations buying in ready to fruit blocks. One consideration is that labor is a cost that can theoretically be improved or reduced on the part of a grower, while the material costs of buying in blocks are likely out of the hands of producers.
2) Scale matters for profitability
The farms producing at the lower end of scale (16 - 24 blocks/week) did not report profitable numbers, while those at 90 blocks/week and above saw positive gains. The chart above that projects figures at various scales suggests profitability at each scale, but remember that this is operating costs only. The fixed and capital costs, along with the number of weeks in production will greatly affect the potential profit or loss of a specific operation. The farms producing 50 lbs or more per week were consistently profitable while the ones below were typically not profitable.
3) It’s important to analyze the yield per block. The range farms reported was .66 to 1.36 pounds per block. This means the proper selection of strains, substrate, and methods could cut potential yields in half, or double them, depending on the choices made. It is recommended that farms track production yields periodically and use this measure as an important element of determining changes that can improve their operation over time.
4) Calculate your hours per pound by tracking your labor!. Growers reported a wide range of values for labor in relation to their yields. The average was .56 hours per pound, with .14 being lowest and 1.52 being highest. In most farm enterprises, labor is the highest cost and also has the highest potential for improvement. Improving the flow of workers and materials, the skills and abilities of your workforce, and the way spaces are set up can all have dramatic effects. As a starting point, it's critical to track your labor and develop a system to make this record keeping simple so that it does not detract from production work.
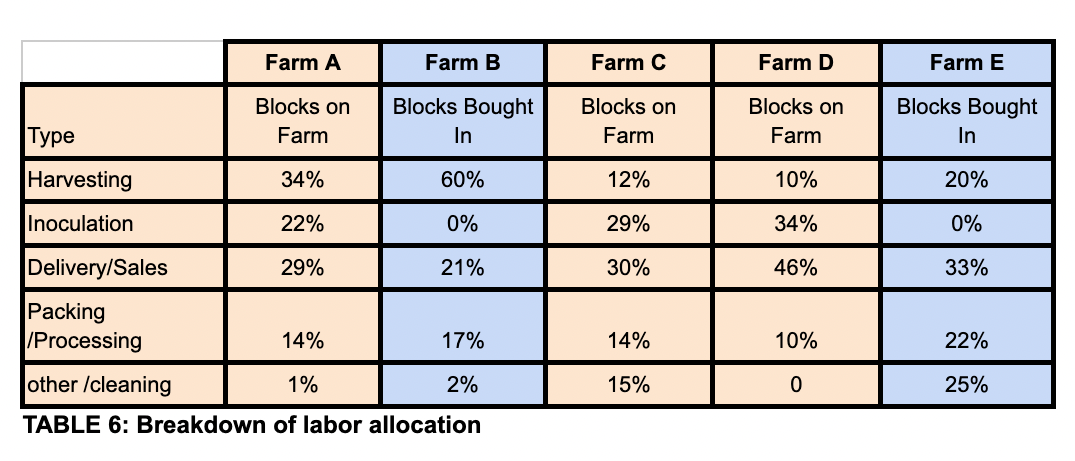
Table 6 offers the breakdown of various tasks within the operations and the rough percentage of the overall labor cost it represents. Some farms expressed that due to the challenges of labor hour tracking, their total hours were likely greater. Some farms accounted for time cleaning while for others it was wrapped into other categories. In retrospect, it would have been best to define cleaning as a separate category, since growers report this is a substantial portion of their time.
Labor accounts for 67% of operating costs, and materials 32% as an average for all the farms. When we look at farms making blocks on site (orange) vs buying in blocks (blue), the breakdown is quite different, with blocks on site at about 20% materials and 80% labor, while ready to fruit block farms have a higher material cost at 58% and labor being 42%.


