Dairy Farm Profit Benchmarks
Dairy Farm Profit Benchmarks
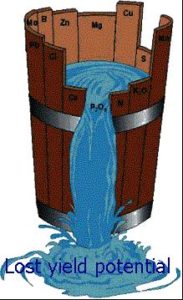
A Farm Business Educator once used the analogy of barrel staves as a way to describe portions of the dairy farm business. If the whole farm was a barrel, then the staves would be represented by: Milk production, Animal Husbandry, Crop Production, Business efficiency, etc. He said that a farm could only produce profit to the level of their shortest barrel stave. In an effort to help New York dairy farmers evaluate their business, the Small Dairy Work Team is providing benchmarks, which will help farm families, compare their business to other dairy businesses of similar size. The following tables have information taken from Cornell’s Dairy Farm Business Summary. Find the table that best describes your dairy’s size and place a mark where your farm falls for each benchmark. The height of your mark represents the height of the staves of your barrel. This will help identify the shortest stave in your barrel and where there is potential for more profit.
40 New York Dairy Farms With 100 to 200 Cows, 2010
| Cows Per Operator | Pounds Milk Sold Per Worker | Pounds Milk Sold Per Cow | Tillable Acres Per Cow |
|---|---|---|---|
| 171 | 971,091 | 25,097 | 4.65 |
| 125 | 798,124 | 21,465 | 3.21 |
| 105 | 715,489 | 20,539 | 2.84 |
| 80 | 623,210 | 17,901 | 2.39 |
| 45 | 457,288 | 13,693 | 1.66 |
| Farm Debt Per Cow | Debt to Asset Ratio | Grain and Concentrate as % of Milk Sales | Cull Rate |
| $570 | .06 | 19% | 16 |
| $1,939 | .17 | 26% | 27 |
| $2,728 | .25 | 29% | 31 |
| $3,885 | .39 | 32% | 34 |
| $6,116 | .53 | 41% | 40 |
47 New York Dairy Farms With Less Than 100 Cows, 2010
| Cows Per Operator | Pounds Milk Sold Per Worker | Pounds Milk Sold Per Cow | Tillable Acres Per Cow |
|---|---|---|---|
| 80 | 783,408 | 24,340 | 5.03 |
| 59 | 630,480 | 21,606 | 3.59 |
| 45 | 532,320 | 19,482 | 3.10 |
| 42 | 422,603 | 17,034 | 2.59 |
| 29 | 314,698 | 13,331 | 1.16 |
| Farm Debt Per Cow | Debt to Asset Ratio | Grain and Concentrate as % of Milk Sales | Cull Rate |
| $130 | .01 | 18% | 13 |
| $1,178 | .10 | 28% | 25 |
| $3,113 | .24 | 31% | 30 |
| $4,368 | .40 | 35% | 33 |
| $7,452 | .65 | 42% | 42 |
How to Calculate Benchmarks
- Cows Per Operator – Total end of year cows in milking herd (plus dry cows) _________Divided by number of full time workers ____________.
- Pounds of Milk Sold per Worker – Total milk shipped for the year ____________ Divided by the number of full time workers ____________.
- Pounds of Milk per Cow – Total Milk shipped for the year ____________ Divided by the number of cows ____________.
- Tillable Acres per Cow- Total acres in crops and pastures ____________ Divided by number of cows ____________.
- Farm Debt per Cow – Total Farm Debt (short term and long term) ____________Divided by number of cows ____________.
- Debt to Asset Ratio – Total Farm Debt ____________Divided by the current value of the business ____________.
- Grain and Concentrate as % of Milk Sales – The easiest way to calculate this is to take the price of one load of purchased grain used for the cow herd and divided it by the value of the milk produced during the period which it took to use the load of grain.
- Cull Rate – The total number of animals leaving the herd during the year divided by the end of year total will give the percentage culled.
HAVE QUESTIONS? Contact your local County Extension Office
Prepared by Fay Benson, Small Dairy Educator with Cornell Cooperative Extension, Cortland County and Mariane Kiraly, Ag Program Leader Delaware County Cooperative Extension. To purchase a copy of the DFBS, contact Linda Putnam – (607) 255-8429 or email lpd2@cornell.edu.


please I need spreadsheet to easy calculate farm profitability