Climate Change on the County Level
If you haven’t already seen the impact of climate change in your area, you can now. A new tool allows users to view change in climate by county, thanks to work by the Cornell Center for Climate Smart Farming and Cornell Institute for Climate Smart Solutions . The tool should be particularly useful to educators, gardeners, farmers, and researchers.
“We’ve talked to farmers and they’ve asked us for how the climate has changed in their specific 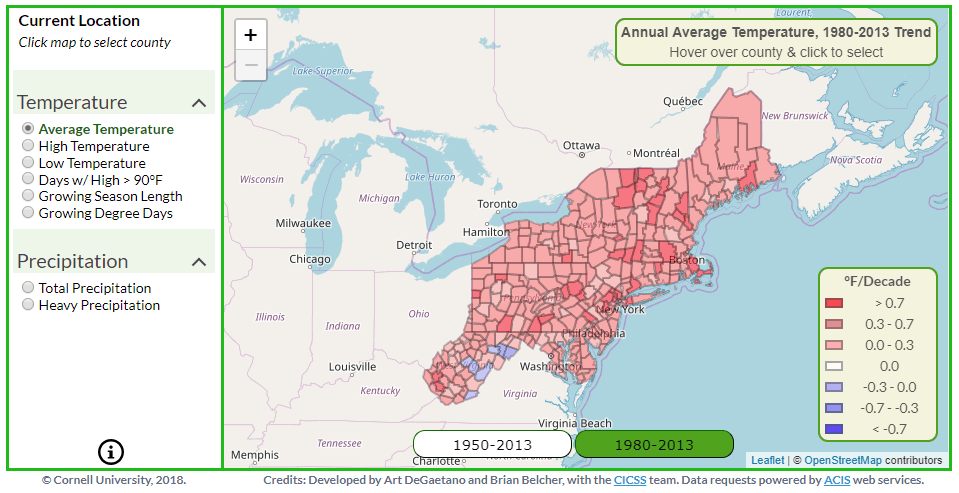 location,” Allison Chatrchyan, director of the Cornell Institute for Climate Smart Solutions, told the Cornell Chronicle. “We know that people can relate more to climate change when the impacts are seen locally and personally.”
The Climate Change in Your County Tool is the culmination of years of data from the Northeast Region Climate Center located in Ithaca. The data, from 1950-2013, shows an overall trend of upward temperatures despite some outlier years and counties. For example, Tompkins County where the Small Farms Program is located, shows an average of 0.2° F per year from 1950 to 2013, and an increased average of 0.6° F per year from 1980 to 2013.
The tool has features other than temperature record. There is an option to see the change in growing season (Tompkins County has an average of 4.1 more days per decade), growing degree days, average high and low temperatures, and number of days over 90° F in a year. The tool is still considered the “beta version,” so there could be more features available in the future.
Want to see the change in your county? Access the tool here.